ADP PostEdge Help
Selecting and
Viewing a Report
The Elements of
the Report List Page
Using the Report
List controls to navigate the report list
Viewing the Next
Set of Reports
Controlling the
Number of Reports on the list
Using the quick
filter controls to narrow down the report list
Filtering Based on
Description or Date
Using the View
Controls to customize the report list
Items on the
Report List - Difference Between Greenbar
and Modeled Reports
To determine how many
records are in the report
To set the
starting record or group
To limit the
records based on specific criteria
Difference Between
Filter on Group and Filter On Search Contents
 The report-mining component of the
ADP PostEdge document management solution offers comprehensive search
functionality to help users locate desired information within both current and
historical reports.
The report-mining component of the
ADP PostEdge document management solution offers comprehensive search
functionality to help users locate desired information within both current and
historical reports.
In addition to presenting data in traditional green-bar format, PostEdge offers extended
report-mining capability by utilizing
XML data models
which allow the user extract filtered information and export into a variety of
formats.
Using a
built-in report writer utility
within the standard application, users are also able to create their own
variations of standard report information by sorting, filtering, grouping and
computing data into more meaningful reports which may not exist in the user’s
current print library.
Users are able to add sub-totals, counts, averages and graphs, and they are able to re-arrange (hide or show) columns based on their presentation preferences. Once data is presented in report models, users are able to build virtual documents by combining two or more similar documents together – this data can be of different report types or from multiple time periods.
Operations personnel require
information from a variety of business critical reports, and there are many
items to consider when analyzing a traditional, paper-intensive business
environment.
Users spend extensive time
and costs to get needed information from multiple, related reports, and it is
often difficult and expensive to create “custom” or “new” reports as business
needs change. In addition, the distribution of information to the people who
need it within a paper-based office is slow and difficult to manage, with
virtually no control over the processes based on the people working with
reports. By providing for the transformation
of reports into data sources which yield more beneficial variations of standard
report output, users can easily get to the information they need.
PostEdge report modeling allows
users to create new reports from existing ones dynamically, with built-in,
user-friendly tools. Report variations are created once and reused as often as
needed, either by the individual author or by his\her organization. Source data
always remains secure, with variations being created as needed, resulting in a
more user-controlled reporting environment.
The log-on page
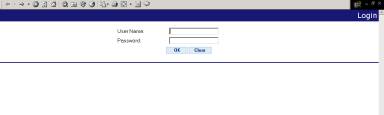
1. Log
into the application by using your browser. The log-on screen displays.
2. Enter
the user name and password assigned to you. The main Summary Page displays.
Note:
The reports list page main page, showing the list of reports and control
sets to navigate or customize the list
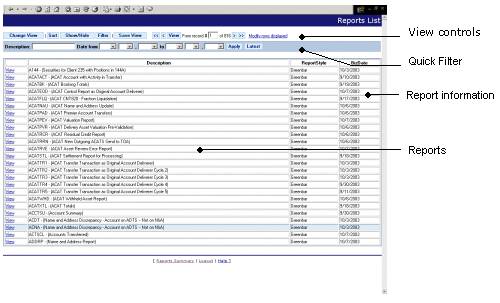
Selecting and Viewing a Report
The Elements of the Report List Page
q
List of Reports
q
Report Information
A
set of controls allows you to navigate the reports on the list. For example,
you can go to the last entry on the list, or select a specific report to go to.
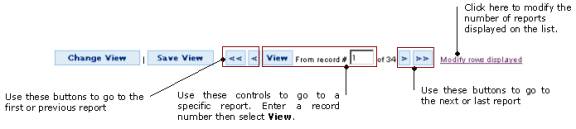
Viewing the Next Set of
Reports
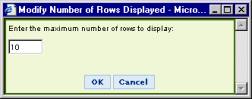
Controlling the Number of Reports on the list
The Quick Filter
controls allow you to narrow down the reports on the list, by entering
Description or Date filter criteria.
Quick Filter controls

Filtering Based on Description or Date
q
Description: enter any part of the report name,
all reports that match the criteria will be returned.
q
Date from: this field represents the start
date of the search and consists of the month, day and year. If the “Date from” field is populated with
the appropriate criteria and the “to” field is left blank, then all reports will
be returned from the date selected until today.
q
To: this field represents the end date
of the search and consists of the month, day and year. If the “to” field is populated with the
correct criteria and the “Date from” field is left blank, all historical
reports will be returned up to the date selected.
q
This action will display the latest run for
each report run and report style.
q
Viewing Latest clears out all previous
Quick Filter values.
The Report List
view determines how the reports are listed. You can select to display the
reports sorted in a different order (for example according to Date in ascending
order, or according to Report Style then Description).
Users can also filter the reports listed (for example,
only those of a specific style).

Changing a View
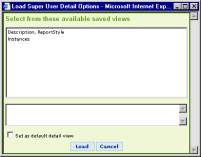
Saving a view
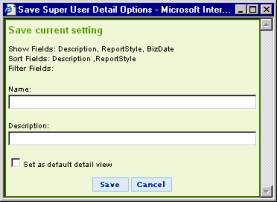
You can return to previous selection pages by clicking on your browser’s back key. You can also use the folder history that displays at the top of your report list.
Items on the Report List - Difference Between Greenbar and Modeled
Reports
q
Greenbar:
displays information as an online text page. Functionality is limited to
search, move (to a specific page), and print.
q
Modeled and Derived Reports: displays
information in html, as a fully interactive report. Functionality includes that
of greenbar, plus: transform (create variations including new grouping,
statistics, and computed fields), export, and join (include data from other
reports)
A greenbar report can be defined as
a static representation of the report data, matching the format and layout of a
printed hard-copy report. Users are
able to perform text searches and page printing using this report format, while
more complex functionality such as exporting and filtering is reserved for the
data model format.
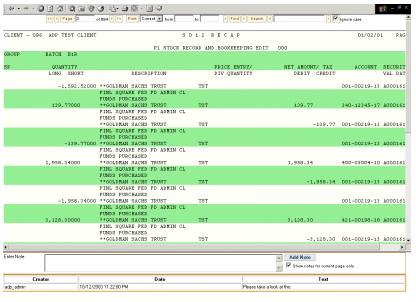
A sample greenbar report.
Greenbar
reports present data as if it where printed to a printer, displaying data on a
page by page level.
q
Enter a page number in the page box and
select the Page button
q
Or select the < and > to move
back or forward one page at a time.
q
Or select << and >> buttons to
go the first or last page respectively.
When
you print greenbar pages, you first need to set the print rage.
1. Drop
the list beside the Print button.
2. Select
one of the following to print:
·
Current (print just the current page)
·
Range (print just a range)
3. If
you selected Range in #2, enter a range of values into the From and To boxes.
4. Select
the Print button. Pages will be printed starting from the current page.
1. Enter
the text you want to search. Remember to check or uncheck ignore case,
depending on your requirement.
2. Select
the Search button. Text that meets your search criteria will be highlighted on
the page.
3. Select
> to move to the next page that contains the text you are looking for.
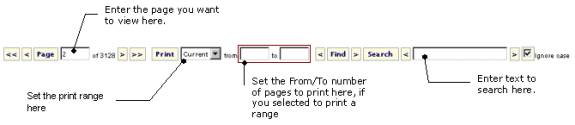
Greenbar Reports toolbar, with the
print range list displayed.

Aside from a normal text search, which allows you to
look for text anywhere on a greenbar page, PostEdge also allows you to do an
index search.
Using this feature, you can search
for values on the key fields of the report. Find is a specialized search
feature that allows the user to find Greenbar pages based on designated index
values such as Branch and/or RR code.
The Find feature is most useful to
users with access to large quantities of information and require an index search
to pinpoint exact data\information. For
example, a user wishes to look up information for two branches. To do this, the user enters the following
criteria Branch = 100 or Branch = 101, and then enters OK.
From the Greenbar report, click the Find
Button. This will bring up the Search
Screen.
The Find page within a greenbar
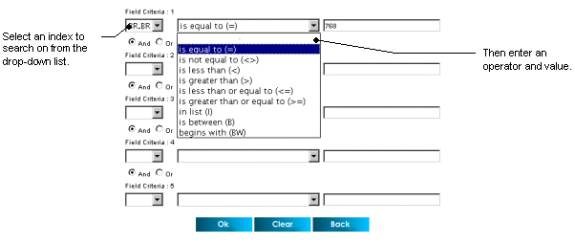
Steps:
1.
Select a field from the drop-down list.
2.
Select an operator.
3.
Select a filter value.
4.
If searching on multiple criteria, select
AND\OR to link criteria.
5. Click
OK. The page with the first
occurrence of the filter criteria appears.
Use the forward (>) and backward (<) button beside the Find button
to go the next or previous pages which matches the criteria.
6. Click
the Find button again and then click Clear to remove your find.
PostEdge allows
you to annotate specific greenbar pages.
This feature is meant to replace had-written notes on reports. To do this, you use the Notes feature. Notes
allow users of the report to share comments, reply to queries, and track
replies.
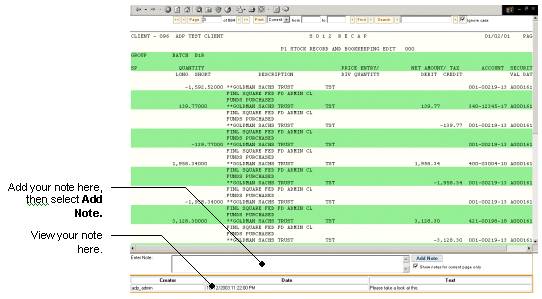
Steps:
1. Locate
the Notes section at the bottom of the greenbar report. On the text area, write
your note. A note will be time-date
stamped with the applicable user ID of the user entering the note. Notes cannot be edited once entered.
2. Select
the Add Note button.
q
Notes are viewable to those users that have
access to the page of data in which the note applied.
q
Notes have a maximum of 255 characters.
q
Notes can only be applied to greenbar
reports and not modeled reports.
A modeled report allows for complex
functionality such as advanced data searches and filtering, as well as
exporting. Users are able to build
analytical derived reports using modeled data.
A modeled view often takes the appearance of a spreadsheet with related
rows and columns.
A sample report model.
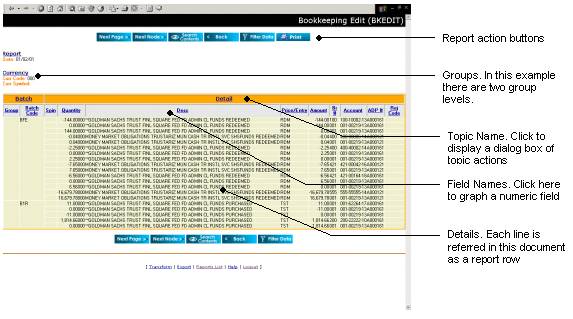
Select the Next Page button.
This will fetch the next set of report data from the server and display on a
new page. Select Back to view
previous pages (see Figure 14).
1. Select the Search Contents button.
The Search Contents page, with an outline displayed at the lower half, is
displayed.
2. Use the outline like you would a
table of contents: expand folders, search on the contents of the folder, and so
on.
To determine how many records are in the report
Select the Search Contents button
(see Figure 14). At the top left corner of the page, the number of records for
each node (or group) is displayed.
To set the starting record or group
1. Select the Search Contents button
(see Figure 14).
2. At the top of the page, enter the
starting record (for example, if you have 100 Departments and you want to view
data starting from the 50th department, enter the value 50)
or:
Set
the starting record value (for example, you want to start only with Departments
starting with E)
3. Select the Set button.
Notice
that the Table of Contents outline changes. The first entry on the outline is
the first group or record that matches your starting criteria.
To limit the records based on specific criteria
1. Select the Search Contents button
(see Figure 14). The Search Contents page is displayed.
2. Select the Search button. The
Search Expression page is displayed.
3. Build your search expression (for
example: Date > 01/10/02 and Amount < 500000.00).
4. Select OK.
The
number of nodes on your outline will be decreased, leaving only those that meet
the criteria you have specified. Your filter criteria will be applied and from
this point on in your session, for the following operations: next/previous
group, export, print, and transform.
Or:
1. While the report is displayed,
select the Filter button (see Figure 14). The Search Expression page is displayed.
2. Build your search expression (for
example: Date > 01/10/02 and Amount < 500000.00).
3. Select OK.
Your filter criteria will be applied and from this point on in your session, for the following operations: next/previous group, export, print, and transform.
Difference Between Filter on Group and Filter On Search Contents
Think
of Filter as a lightweight version of Search contents.
Filter searches for matches to your
specified criteria in the first 1000 pages (or less) within the group
you are currently in. If no matches are found within that area, then PostEdge
will report that there are no matches.
Search
Contents, on the
other hand, does a complete search of the entire report, it takes a little
longer, but it is complete.
Thus:
q use
Filter if you want to do a quick search within the immediate group you
are working on, and to see if there are any records that match your criteria
within the next few pages.
q Use
Search Contents to do a longer but more comprehensive search of the entire
report.
1.
While
the report is displayed, select the Export link at the bottom of the
page. The Export dialog box is displayed.
2.
Select
the export format:
q Microsoft
Excel
q XML
q Tab-delimited
q Comma-delimited
q Plain
Text
3.
Select
the range of values to export
Use the outline like you would a table of contents: expand folders, search on
the contents of the folder, and so on.
q Export
the entire report
q Export
just the current node (current group)
4.
Click
the check box if you want to suppress repetition.
5.
Select
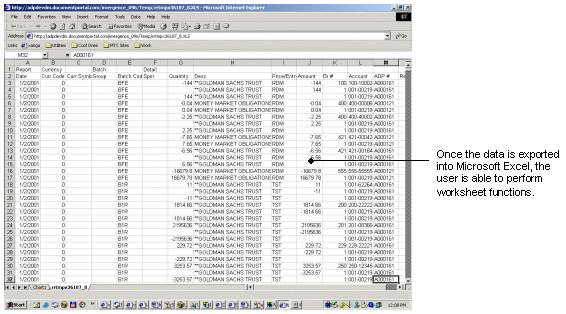
OK. Data will be exported and placed in a temporary file on the Server.
You are provided a link you can click on to view the exported data on your
client.
The results of an export to Excel
1. While the report is displayed,
select the Transform link at the bottom of the page. The Transform
dialog box is displayed.
2. Select the following:
q
Adhoc Transformation if you want to create
a new variation of the report
q Adhoc
join if you want to combine data from another report.
3. Verify that you want to use an
ActiveX Control (for first time users, additional software will be downloaded
and installed on your machine).
If
you do not want to work with an ActiveX Control, uncheck the box. In this case,
you will work with an HTML interface.
4. Select Apply. The PostEdge
Developer will be downloaded and/or displayed.
5. Carry out your transformation and
then save (See Transforming a Report)
The PostEdge data transformation tool.
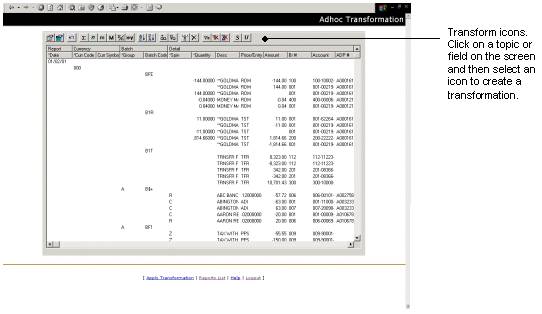
Statistics
carry out computation on the current columns on your report. For example, you
can sum up the rows or count the number of rows.
1. Select any of the fields on the
Developer interface (For the next several sections, the Transformation tool -
see Figure 16 – is referred to as the Developer Interface. Sample expressions and data examples are
provided which are not represented in this figure, but can be used to
illustrate the intended functionality).
2. Select any of the following
statistics icons on the toolbar:
q
Sum
q
Count (of records)
q
Show max value
q
Show min value.
1. Select
any of the fields on the Developer interface.
2. Select
the Sort Ascending or Sort Descending icon on the toolbar.
When
you group on a field, that field and everything to the left of that field until
the next topic will be included in the new grouping.
Before Grouping:
Cust Invoice# ProdID ProdAmt
-------------------------------------
Cust
A C1-005 510 20.00
Cust
A C1-005 320 20.00
Cust
A C1-006 250 30.00
Cust
A C1-006 781 30.00
Cust
B C1-007 530 120.00
Cust B
C1-007 543 120.00
After grouping on Invoice Number:
Cust Invoice# ProdID ProdAmt
-------------------------------------
Cust
A C1-005 510 20.00
320 20.00
Cust
A C1-006 250 30.00
781
30.00
Cust
B C1-007 530 120.00
543
120.00
After further grouping on Cust:
Cust Invoice# ProdID ProdAmt
-------------------------------------
Cust
A C1-005 510 20.00
320
20.00
C1-006 250 30.00
781 30.00
Cust
B C1-007 530 120.00
543 120.00
Steps:
1. Select
any of the fields on the Developer interface.
2. Select
the Group or Ungroup icon on the toolbar.
1. Select
any of the fields or topics on the Developer interface.
2. Select
the Delete icon on the toolbar.
A
filter controls the records that are displayed on the report. The original data
is still stored on the server, but only information that meets your criteria is
displayed on your report.
1. Select any of the fields on the
Developer interface.
2. Select the Add Filter icon on the
toolbar. The Filter Criteria dialog box displays.
3. You can initially define a simple
filter (e.g. select an operator and then a value, for example: > 100000) or
you can select the Custom button to display the Filter Expression builder.
1. Select
the field whose filter you want to clear.
2. Select
the Clear Filter icon on the toolbar.
Select the Clear All Filters icon on the toolbar.
1. Select
any of the topics except the last one.
2. Select
the Summarize icon on the toolbar. All topics to the right of the current topic
will be cleared, leaving only all the statistic values.
Example
Before Summarizing:
Customer Invoice
Product
----------
-------- -------------------
Customer Inv#
ProdID ProdAmnt
----------
------ ------- ----------
Cust
A C1-005 510 20.00
320 20.00
----------
40.00
C1-006 250 30.00
781 30.00
----------
60.00
----------
100.00
Cust
B C1-007 530 120.00
543 120.00
----------
240.00
--------------------
340.00
After summarizing on Invoices:
----------
-------- ----------
----------
------ ----------
Cust
A C1-005 40.00
C1-006 60.00
----------
100.00
Cust
B C1-007 240.00
----------
240.00
--------------------
340.00
After summarizing on Customer:
----------
----------
----------
----------
Cust
A 100.00
Cust
B 240.00
---------------------
340.00
1. Select
the field where you want to insert the new field (the new field will be
inserted before the field you selected). The Field dialog box is displayed.
2. By default, the new field name is
named as New<field number>. Delete the default field name and type in the
name of the computed field into the Name edit control.
3. Enter
a description of the computed field into the Comments edit control.
4. Select
the data type of the new field by clicking on the corresponding radio button.
5. Type
in the maximum length of the data field.
6. Click
on the key field check box if you want the field to be the key field.
7. Click
on the particular statistic that you want to include in the computed field column.
8. To
define an expression, select the Expression button.
This dialog box contains the
following information:
q Group
list box contains a list of the categories of all the expression that you can
use in creating the expression.
q Items
list box contains all the items included in each of the elements in the Group
list box.
q Literal
text box is where you enter the literal that you want to use in your
expression.
q Expression
text box contains the expression that you defined.
9. Define
the expression.
10. After
defining the expression, select the OK button of the Expression dialog
box. You are returned to the Data Row Field dialog box.
11. Select
the OK button of the Data Row Field dialog box.
1. After carrying out your
transformation steps, select Apply Transformation. The Save Analysis dialog box
is displayed.
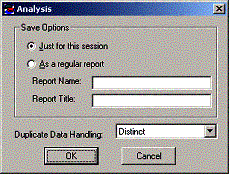
2. Set how the transformation will be
saved:
q Just for this session, the transformation rules and the
resulting report are just temporary. They exist only while your session exists.
q As a regular report, the transformation rules are saved
on the server. This is important: only the rule, not the report, is saved. When
a new report becomes available (i.e., a new set of data for the next day), you
can apply the saved rules to that report as well.
3. Set Duplicate Data Handling.
If
your transformation rules rearrange information in such a way that duplicates
rows are produced, or if you start out with a report where lines are duplicated,
you need to tell PostEdge how these duplicates will be handled.
You
can select from the following:
q Distinct: with this
strategy, PostEdge ensures that only one distinct instance of records (as based
on index fields) are written to the new report.
q Both: with this strategy,
PostEdge ensures that all records are written to the new report.
q
Remove: with this strategy, PostEdge ensures that all duplicate
rows are removed.
|
FUNCTION |
DECSRIPTION |
|
@Month |
Returns month of a given date |
|
@Day |
@Day(<date yyyy-mm-dd>) Returns day of given date |
|
@Year |
@Year(<date yyyy-mm-dd>) |
|
@Now |
Returns the current system date |
|
@DateDiff |
Get date difference |
|
@DateAdd |
@DateAdd(<date yyyy-mm-dd>,
<Days as Long>) Add a year, month or day to a
specified date |
|
@Concat |
Concatenate fields |
|
@Substring |
@Substring(<String>,
<Start>, <Long>) Extracts a substring from a string |
|
@ToLong |
Change a data type to Long data
type |
|
@ToFloat |
Change a data type to Float data
type |
|
@ToString |
Change a data type to String data
type |
|
@ToDate |
Change a variant into Date |
|
@IfString |
@IfString (<Bool>, <True
String>, <False String>) Define String values depending on
a particular condition |
|
@IfDate |
@IfDate(<Bool>, <True
date yyyy-mm-dd>, <False date>) Define Date values depending on a
particular condition |
|
@IfLong |
@IfLong(<Boolean>, <True
Long>, <False Long>) Define Long values depending on a
particular condition |
|
@IfFloat |
@IfFloat(<Bool>, <True
Float>, <False Float>) Define float values depending on a
particular condition |
|
@FloatToFraction |
@FloatToFraction(<Variant>,
<Long>) Express any data type to fraction
form |
Sample Topic Action dialog box
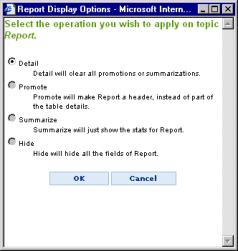
Topics
organize the information on your report. By promoting a topic to create a group,
you can simplify the way information is accessed, since you can move from one
group to the next, initially ignoring the details. (Also see Group/Ungroup in Transformation Actions).
1. Select any of the topics on the
report (as represented by the first-row header captions). The Data Topic
options dialog box is displayed.
2. Select Promote, then OK. You
are returned to the report, this time showing information for one group at a
time.
Select Next/Previous Group to
view the information for the next or previous group.
If
you need to return a report to detail mode (i.e., remove a group), you unpromote
it.
1. Select a currently promoted topic.
The Data Topic options are displayed.
2. Select Detail then OK.
You are returned to the report, this time showing information for one group at
a time.
When you summarize a topic, the
details are suppressed, leaving only the totals. (Also see
Summarize/Unsummarize in Transformation Actions).
1. Select
any of the topics on the report (the first-row header captions), except the
last one. The Data Topic options is displayed.
2. Select
Summarize, then OK. All the topics to the left of the current topic
are summarized to show only the statistics.
1. Select
any of the topics on the report (the first-row header captions). The Data Topic
options are displayed.
2. Select
Hide. All the topics starting from the current one and all the topics to the right
are hidden.
1. Select
the currently showing topic. The Data Topic options box is displayed.
2. Select
Detail, then OK. You are returned to the report, this time
showing the topics that had been previously hidden.
Sample Field Action dialog box. You use this to graph a numeric
field.
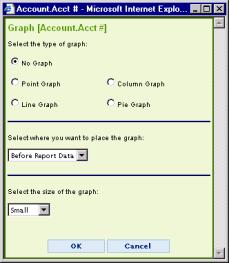
1. Select
any numeric field. The Graph Field dialog box is displayed.
2. Select
the following:
·
Graph Type: whether pie, column, etc.
·
Graph Size: currently you only have two
choices: small or large.
·
Position
3. Select
OK. You are returned to the report, with the graph displayed.
Notes:
q you
can only graph numeric fields
q values
displayed on the graph are the values displayed on the current group of the
current page.